In physics equipotential lines describe lines in space which are at the same potential, for example of the electric field.
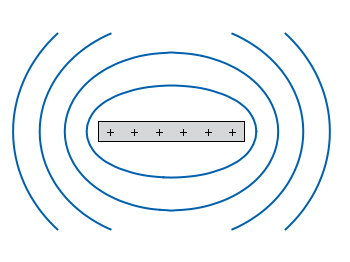
Fig. 1 Equipotential lines of a plate with electric charges (code to produce this figure)
In Fig. 1 equipotential lines for the electric field of six charges equally spaced on a plate are shown. In order to get these lines we need the function of the potential
v(x,y) and make a contour plot with splot to a file to save the positions of the lines.
The positions of the lines are given by the
cntrparam levels which are chosen in a way, to get equally spaced lines in the far field. The set table command stores the contour lines to a file, and finally the last command plots the stored lines.
In addition to the equipotential lines the value of the contour is stored as a third column in the
equipotential_lines.txt file and can be plotted on the graph, too. This is shown in Fig. 2.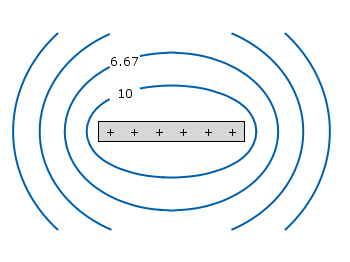
Fig. 2 Equipotential lines of a plate with electric charges with labels (code to produce this figure)
To get the label of the contour we have to choose a
x-position which is given by lx0 in the following. The labels(x,y) function sets a string to the value of the third column, if the right x-position is given and we are above the plate. The function f(x,y) checks if we are near the point where a label should be drawn and undefines the contour line around this point. The size of this area is given by eps.
No hay comentarios:
Publicar un comentario